Welcome to the bililite.com webservices
Web services are web pages designed to be used
by other websites, rather than viewed directly by users. The bililite.com web services evolved from the
original bilirubin graph to allow generation of many of the graphs that pediatricians need, such as
height, weight, peak flows, and, of course,
bilirubin levels. For instance,
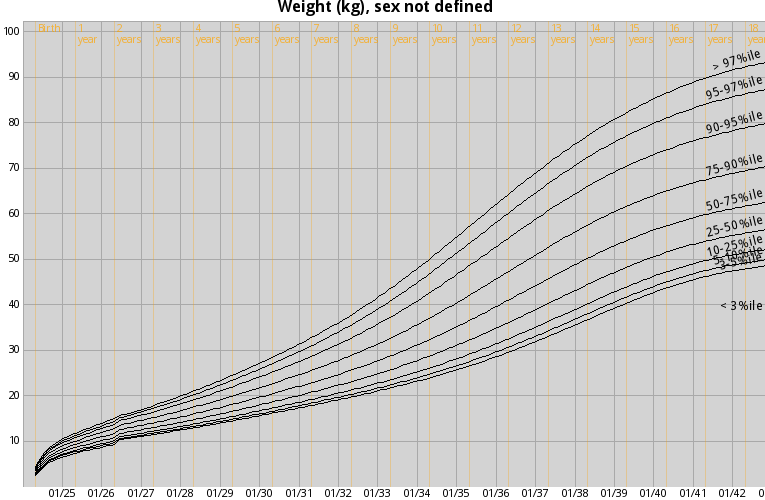
/webservices/wt.png will give you a growth chart for weight that you can use as the source of an <img>
element on your website. Options are part of the query string:
/webservices/wt.png?birth=2/12/1998&sex=male&date[]=4/12/1998&data[]=8&date[]=1/15/2004&data[]=25 sets the birth date and plots two points (at 2 months and 6 years) of his weight.
![/webservices/wt.png?birth=2/12/1998&sex=male&date[]=4/12/1998&data[]=8&date[]=1/15/2004&data[]=25](http://bililite.com/webservices/wt.png?birth=2/12/1998&sex=male&date[]=4/12/1998&data[]=8&date[]=1/15/2004&data[]=25)
The web services are designed to be RESTful,
which means that all the information needed to get the resource (the image or the data) is contained in the URL. The URL always
looks like http://bililite.com/webservices/graph-type.output-type?options.
Graph types
- bili (bilirubin)
- bmi (body mass index)
- bp (blood pressure)
- blank (general charting)
- ht (height)
- ofc (head circumference)
- pf (peak flow)
- wt (weight)
As an aside, I thought about adding EKG parameters, but those aren't usually graphed and there isn't good percentile data, just normal/abnormal. If you would like that, please contact me. For EKG interpretation, see the University of Chicago Pediatric Cardiology site, especially their Pediatric Electrocardiography page.
Output types
- csv
- gif
- html
- jpg
- js
- png
- txt
- xml
html shows a simple form for entering data. gif, jpg, and png
return an image of the graph. png returns the best output, but Microsoft Internet Explorer older than version 8
doesn't handle it particularly well (there's a pale blue background), so you can use gif instead. jpg is
included for completeness, but the image is blurry. txt returns a very terse text; just the computed
zones for the data. csv returns a
Comma-Separated Values file that represents
the raw data for the zone lines. xml and js return the data and the computed zones
as
XML or JSON, respectively. pdf creates a simple PDF file of the graph that can be easily printed. It allows for many more options.
Zones are also plotted on the graphs, such as the "Low Risk Zone" on a bilirubin graph, "50-75 %ile" on a growth chart, or "Green Zone" on a peak flow graph.
For more sophisticated websites, the web services can also calculate the appropriate zone and return the data in XML or JSON format or plain text. For example, /webservices/bili.xml?birth=1/1/2009 4am&date[]=1/2/2009 6am&data[]=4&date[]=1/3/2009&data[]=10 returns an XML structure like:
  <?xml version="1.0" encoding="UTF-8" ?>
  <bililite-webservices>
    <title>Risk of Hyperbilirubinemia</title>
    <birth>1230800400</birth>
    <points>
      <point>
        <time>1230894000</time>
        <value>4</value>
        <label>Low Risk</label>
      </point>
      <point>
        <time>1230958800</time>
        <value>10</value>
        <label>Low Intermediate Risk</label>
      </point>
    </points>
  </bililite-webservices>
And /webservices/bili.js?birth=1/1/2009 4am&date[]=1/2/2009 6am&data[]=4&date[]=1/3/2009&data[]=10 returns a JSON structure like (on one line; separated here for legibility):
{
  "title": "Risk of Hyperbilirubinemia",
  "birth": 1230800400,
  "points": [
    {
      "time": 1230894000,
      "value": 4,
      "label": "Low Risk"
    },
    {
      "time": 1230958800,
      "value": 10,
      "label": "Low Intermediate Risk"
    }
  ]
}
Adding a callback=functionName to the js options creates a JSONP call;
/webservices/bili.js?callback=foo&birth=1/1/2009 4am&date[]=1/2/2009 6am&data[]=4&date[]=1/3/2009&data[]=10 returns:
foo({
  "title": "Risk of Hyperbilirubinemia",
  "birth": 1230800400,
  "points": [
    {
      "time": 1230894000,
      "value": 4,
      "label": "Low Risk"
    },
    {
      "time": 1230958800,
      "value": 10,
      "label": "Low Intermediate Risk"
    }
  ]
})
The numbers represent the UNIX timestamp of the date and time, which is the number of seconds since midnight January 1, 1970.
Options
There are many options available, most with reasonable defaults.
General options
birthandbirth-time- The patient's birth date and time. The two fields are concatenated and passed to strtotime
to determine the date/time. Strtotime is very sophisticated; just about any format or words works. It assumes
the American format for dates; "1/3/2009" is interpreted as January 3, 2009, not 1 March 2009. "1.3.2009" does use the European format;
it is 1 March 2009. "today", "yesterday", "9 years 7 months ago" work as expected. The last format is very useful for older children; a
seventeen-year-old would have
birth=17 years agowithout having to remember his exact birthdate. Most graphs do not need the time of birth; only the bilirubin plot does. birthandbirth-timeare separate fields for the convenience of users who want to use HTML forms with separate input boxes for time and date, similar to my original bilirubin form.birth=1/2/2009 6am,birth=1/2/2009&birth-time=6am, andbirth-time=1/2/2009 6amare all completely identical.- The default is the current time (for our servers in New York).
date[],time[]anddata[]- To plot data on the graph, use pairs of
date[]=date string&data[]=nnnfor each data point. Don't forget the [] after the keywords. I apologize for the similarity between date and data; I've made that typo myself. Eachdate[]andtime[]are combined as withbirthandbirth-timeabove. Be consistent in a single URL; usedate[]andtime[]or both for each data point, or the program will become horribly confused. - These dates are relative to the birth date, so
date[]=5 yearswill correctly get the date 5 years from birth. However, the specific terms now, today, yesterday and tomorrow and any string with next or ago will be relative to the current time. So /webservices/pf.txt?birth=9 years ago&date[]=yesterday&data[]=160&date[]=today&data[]=240 finds the peak flow zones for today and yesterday for a 9-year-old. The term birth is also recognized. - The default time is the current time; if the data is not set it is ignored.
- datablob
- As an alternate to
date[],time[]anddata[]arrays, all the data can be sent as a single text string (as would be sent with a<textare>element). The format is a list of newline-delimited pairs, each pair being a tab, comma or semicolon-delimited date and data. Note that a newline is URL encoded as %0A. - So /webservices/pf.txt?birth=9 years ago&datablob=yesterday,160%0Atoday,240 would give the same result as the previous example.
Graph options
General graph options
graph-only- Set this to only output the graph itself, without axis labels or title. Default: not set.
ages-only- Set this to use ages (birth, 1 year, 2 years) for the x-axis rather than dates. Useful for printing a general-use graph, not personalized for a specific patient. Default: not set.
base-color- CSS color for the background of the axis labels and the title. Default:
transparent, except for gif output, when it iswhite(the anti-aliasing looks ugly otherwise). title- Title for the graph. Default: set by the type of graph.
format- Size of the graph, in pixels, in the form '(x,y)'. The parentheses are mandatory and no spaces are allowed. Default: (765,500).
- For convenience with forms, the format can be specified with two parameters,
xsizeandysize, both in pixels. - The format can also be one of the following predefined formats:
a3- 297 × 420 mm
a4- 210 × 297 mm
a5- 148 × 210 mm
letter- 8.5 x 11 inch
legal- 8.5 x 14 inch
3r- 3.5 x 5 inch (photograph size)
passport- 2 x 2 inch
-L' to the names above to draw in landscape mode; thusformat=letter-Lis 11 x 8.5 inches. margin- Size of the margin around the graph, in pixels.
formatgives the total size;marginreduces the graph drawn. Default: 0. - The margins may also be specified individually, as
tmargin,rmargin,bmargin, andlmarginfor top, right, bottom, and left margins respectively. background-color- CSS color of the graph itself. Default:
lightgray. min- Value for the low end of the vertical axis. This may be adjusted to a "round number" but will always be included
in the graph. Can be a number or
autofor the program to find a value that includes all the lines and data. Default: 0. max- Value for the high end of the vertical axis. This may be adjusted to a "round number" but will always be included
in the graph. Can be a number or
autofor the program to find a value that includes all the lines and data. Default:auto. time-min- Date and time for the low end of the horizontal axis. This may be adjusted to a "round number" but will always be included
in the graph. Default:
birth. time-max- Date and time for the high end of the horizontal axis. This may be adjusted to a "round number" but will always be included
in the graph. Default:
18 years 6 months.
Grid lines
grid-color- CSS color of the grid lines. Default:
darkgray. grid-thickness- Thickness of the grid lines, in pixels. Default: 1.
Title
title-color- CSS color of the title text. Default:
black. title-font- Font name of the title. Default:
 (
(DroidSans-Bold). title-fontsize- Size of the title text, in points. Default: 12
Axis labels
axis-color- CSS color of the axis labels. Default:
black. axis-font- Font name of the axis labels. Default:
 (
(DroidSans). axis-fontsize- Size of the axis labels, in points. Default: 8
tics- Approximate number of "tics" (values shown) on the vertical axis. This is taken as a guide, an order of magnitude only. Default: 7.
time-tics- Approximate number of "tics" (values shown) on the horizontal axis. This is taken as a guide, an order of magnitude only. Default: 8.
Labels (the zones in the graph)
labelline-color- CSS color of the zone lines. Default:
black. labelline-thickness- Thickness of the zone lines, in pixels. Default: 1.
label-color- CSS color of the zone labels. Default:
black. label-font- Font name of the zone labels. Default: (
DroidSans). label-fontsize- Size of the zone labels, in points. Default: 10
label-mark- URL of the marker at each point on the zone lines, or leave unset to not show any marker (the lines will still be drawn). Default: not set.
Data points
dataline-color- CSS color of the lines between data points. Default:
transparent(lines are not drawn). dataline-thickness- Thickness of the lines between data points, in pixels. Default: 1.
mark- URL of the marker at each point on the zone lines, or leave unset to not show
any marker (the lines will still be drawn). Default:

http://bililite.com/images/silk/asterisk_orange.png.
Ages
The horizontal axis shows actual dates and times. It is also useful to show the patient's age, so the upper border of the graph is labelled with the patient's age at regular intervals.
ageline-color- CSS color of the age-indicating lines. Default:
rgba(255,165,0,.3)(almost transparent orange). ageline-thickness- Thickness of the age-indicating lines, in pixels. Default: 1.
age-color- CSS color of the age text. Default:
rgba(255,165,0,.7)(semi-transparent orange). age-font- Font name of the age text. Default: (
DroidSans). age-fontsize- Size of the age, in points. Default: 8
age-tics- Approximate number of ages shown. This is taken as a guide, an order of magnitude only. Default: 5.
Please contact me if you have any request or questions.