Plots the bilirubin as a function of age, for use with the AAP Clinical Practice Guideline, Management of Hyperbilirubinemia in the Newborn Infant 35 or More Weeks of Gestation.
The default graph is taken from figure 2 of that paper. If the query string
of the URL for the graph includes the field type=management then the graph is synthesized from figures 3 and 4, in a way that
I find more useful. The program determines the risk of kernicterus (as described below) and returns one of three graphs,
with the appropriate phototherapy line from figure 3 and the exchange transfusion line from figure 4. Also, our department generally
recommends physician follow up within 24 hours for infants in the "high intermediate risk" zone in figure 2 and within 48 hours for infants
in the "low intermediate risk" zone, so those zones are also plotted on the suggested management graphs.
The AAP in the caption to figure 3 identified eight risk factors for kernicterus (not necessarily for higher bilirubins, but
for an increased risk of bilirubin encephalopathy at high levels): isoimmune hemolytic disease, G6PD deficiency, history of
perinatal asphyxia, significant lethargy, temperature instability, sepsis, acidosis, and albumin < 3.0 g/dl. These are indicated
in the URL by setting the fields hemolysis=yes&g6pd=yes&asphyxia=yes&lethargy=yes&temp=yes&sepsis=yes&acidosis=yes&albumin=yes,
as appropriate (actually, the fields can be set to any value, not just yes).
Prematurity is an independent risk for kernicterus, indicated by premie=yes. Prematurity is defined as 35–36 6/7
weeks gestational age; the graphs are inappropriate for more premature infants. If the infant has neither prematurity nor any of the above risk
factors, the low risk graph is used. If the child is both premature and has any of the risk factors, the higher risk graph is used. If only one
of those conditions is present, the medium risk graph is used.
If you want to directly determine the appropriate management graph, use the fields risk=high, risk=medium, or
risk=low.
Table 2 in the AAP guidelines identifies other risk factors for elevated bilirubin (again, not necessarily the same as the risk factors for kernicterus). Some of the more common are recorded on this HTML form, but they do not affect the graph.
Examples
- /webservices/bili.png?birth=1/2/2009 4:53am&date[]=1/3/2009 6am&data[]=10&date[]=1/4/2009 6am&data[]=11
- Graphs two bilirubin levels, at about 24 and 48 hours old, showing zones of risk of hyperbilirubinemia
- /webservices/bili.txt?birth=1/2/2009 4:53am&date[]=1/3/2009 6am&data[]=10
- Returns the risk zone for a single bilirubin measurement
- /webservices/bili.js?birth=1/2/2009 4:53am&date[]=1/3/2009 6am&data[]=10&date[]=1/4/2009 6am&data[]=11&callback=show
- Returns a JSONP call with the risk zones for two measurements
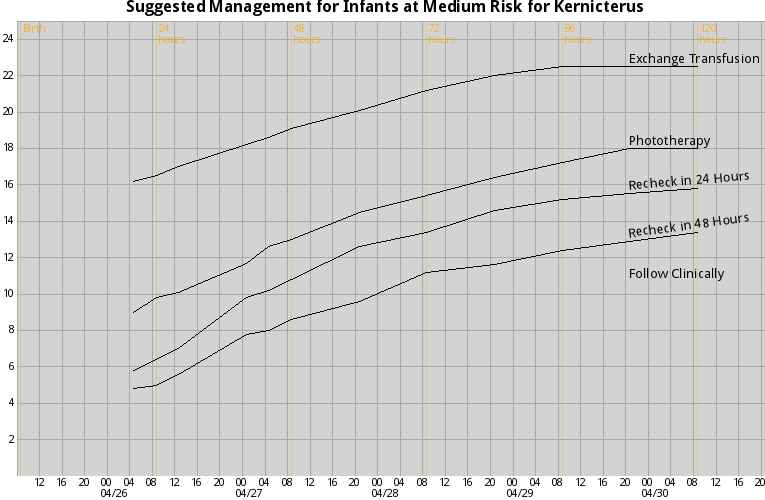
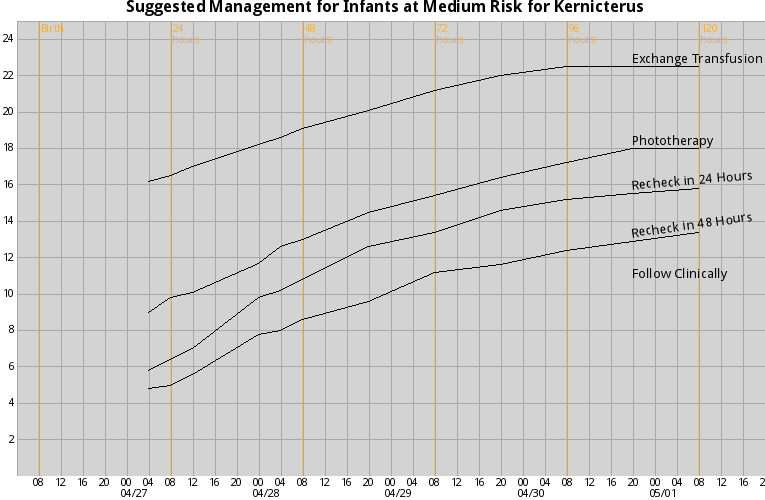
- /webservices/bili.png?type=management&risk=medium
- Graphs the suggested management for an infant at medium risk (either premature or has risk factors) for kernicterus. Note that without
a
birth=date/timefield, it assumes the birth is now - /webservices/bili.png?type=management&g6pd=yes&hemolysis=yes
- Presents the same graph, but letting the program determine the risk factors
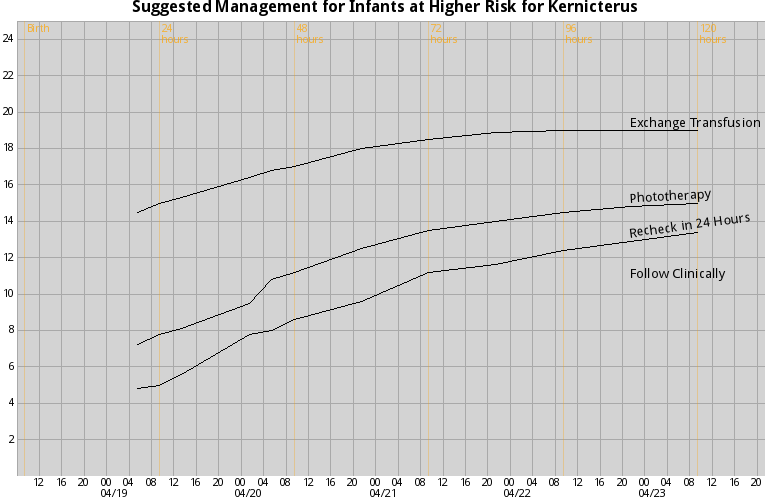
- /webservices/bili.png?type=management&g6pd=yes&hemolysis=yes&premie=yes
- Infant at higher risk for kernicterus
![/webservices/bili.png?birth=1/2/2009 4:53am&date[]=1/3/2009 6am&data[]=10&date[]=1/4/2009 6am&data[]=11](http://bililite.com/webservices/bili.png?birth=1/2/2009 4:53am&date[]=1/3/2009 6am&data[]=10&date[]=1/4/2009 6am&data[]=11)